Tianye-Song.github.io
Outline
Summary of the project
What is your happiest moment in the past 24h? In my final project, I will visualize the distribution of people’s happy moment in differnet categories and the distribution of words from subject’s, verb’s, and object’s perspectives according to the survey data.
Structure
- Ask the audience their happiest moment in the past 24h.
- Show the audience the happy moment category distribution accoridng to the survey data.
- Show the happy moment subject distribution and the distribution of different categories for the top 1 subject.
- Show the happy moment verb distribution and the distribution of different categories for the top 1 verb.
- Show the happy moment object distribution and the distribution of different categories for the top 1 object.
Sketches
-
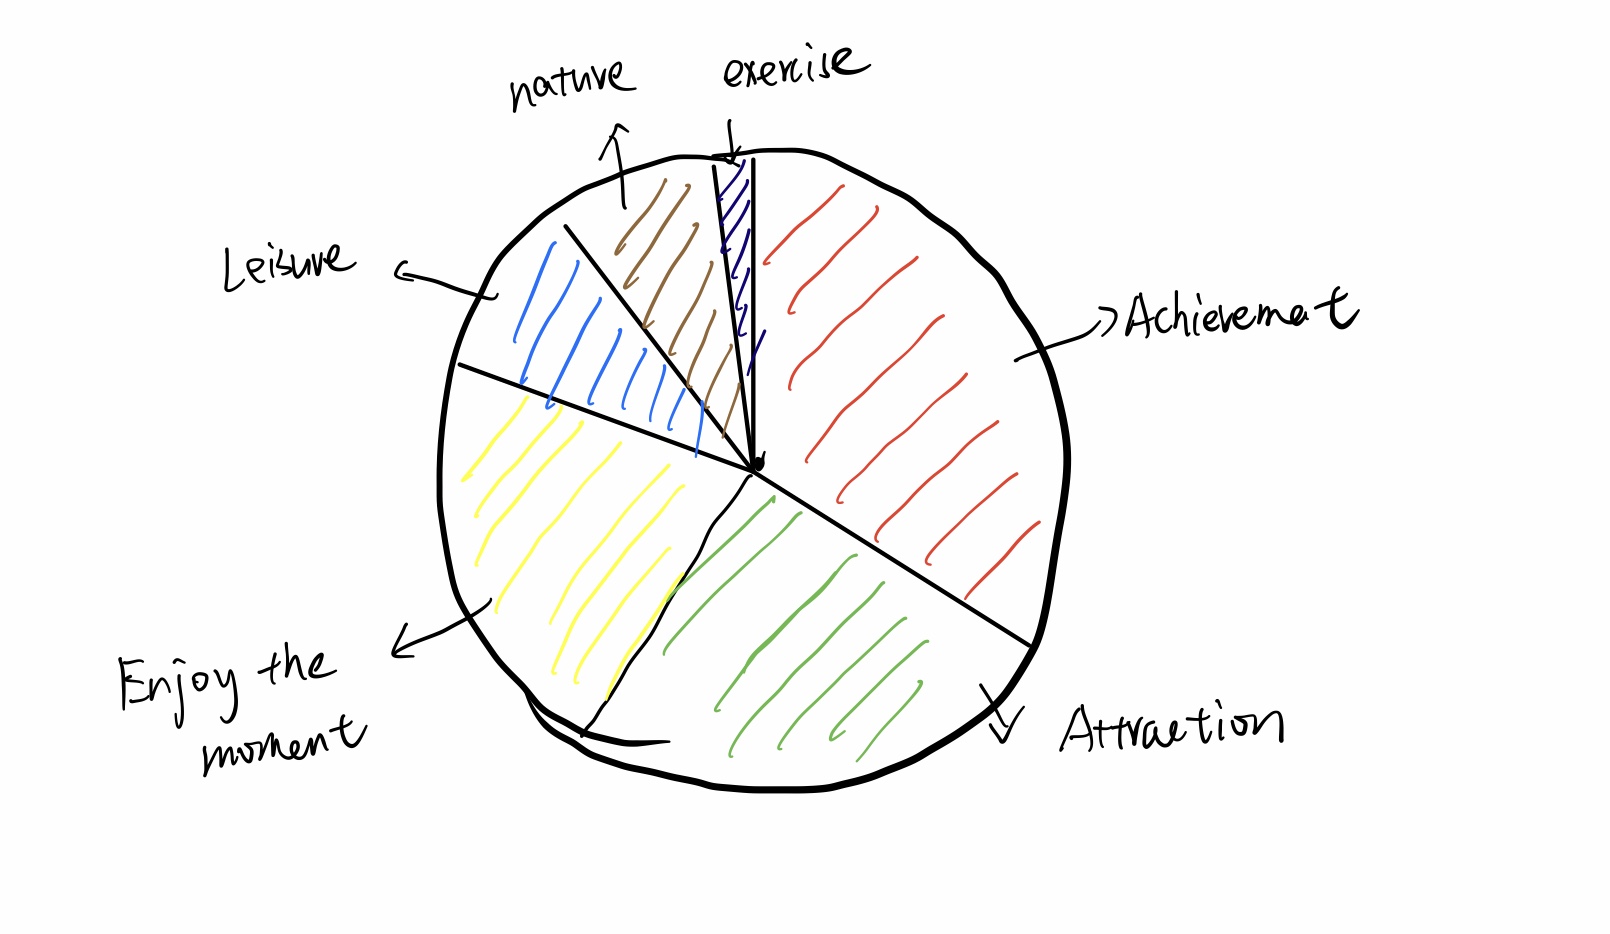
The happy moment category distribution by pie chart.
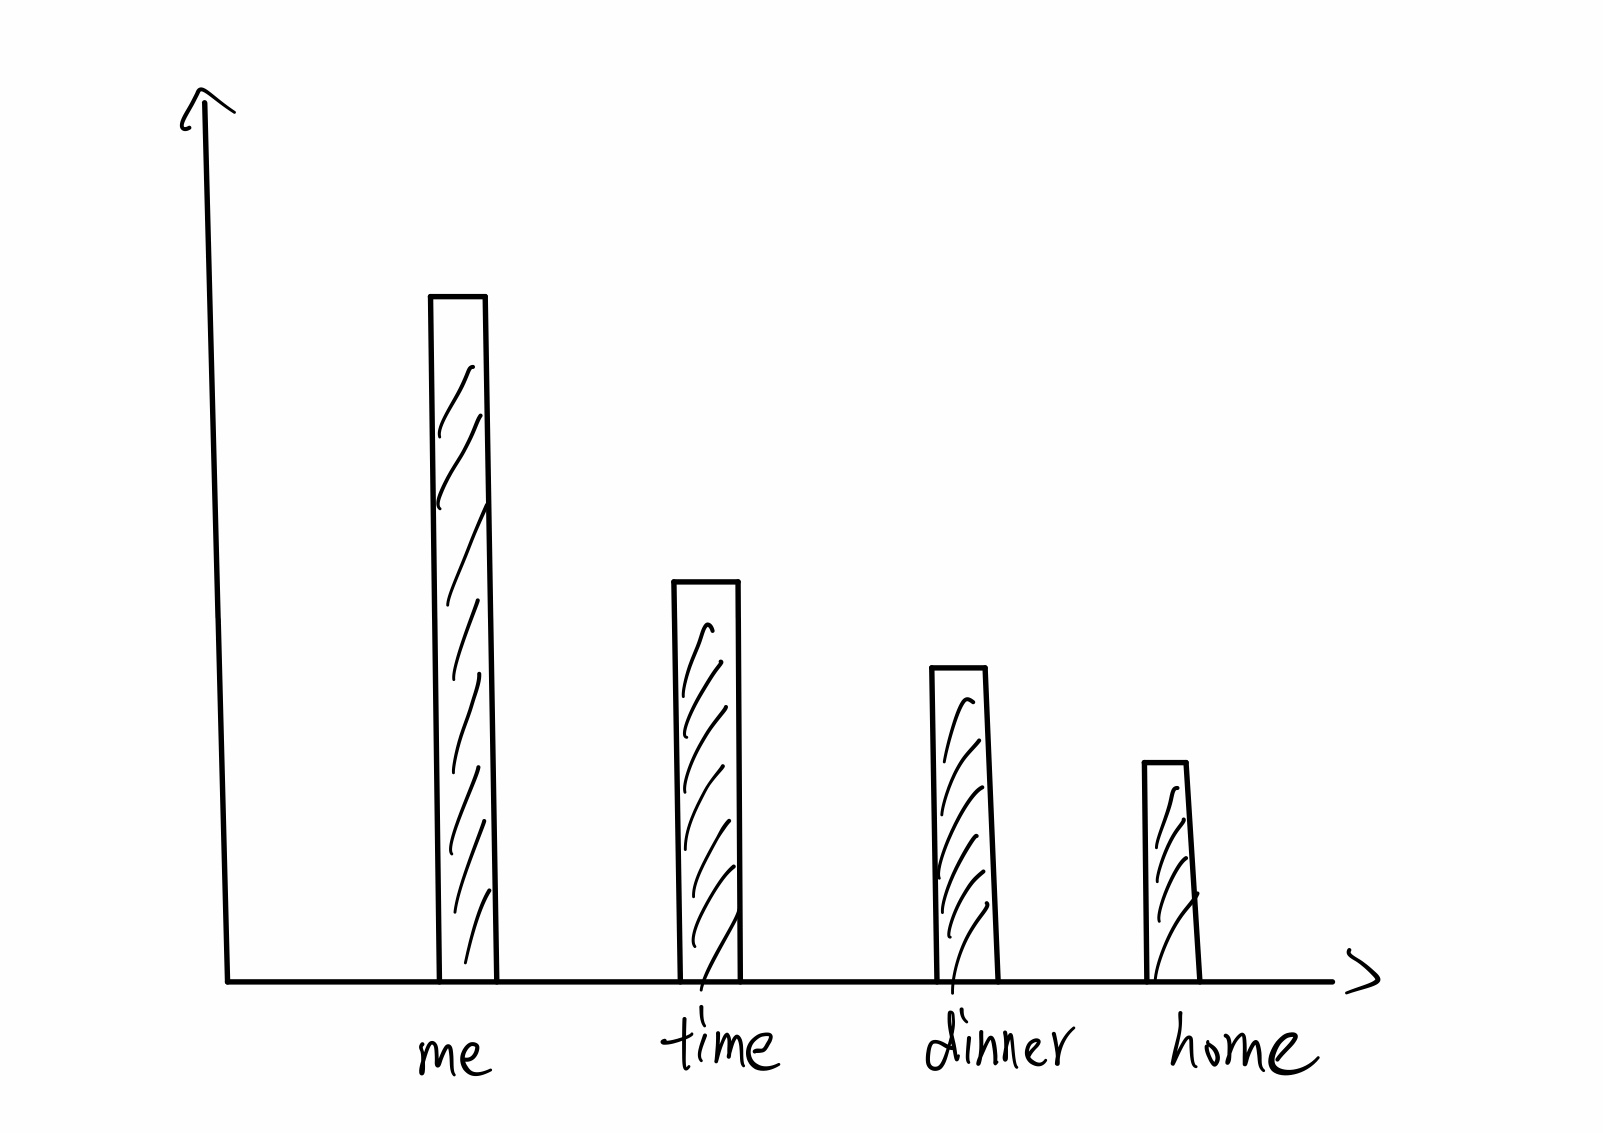
-
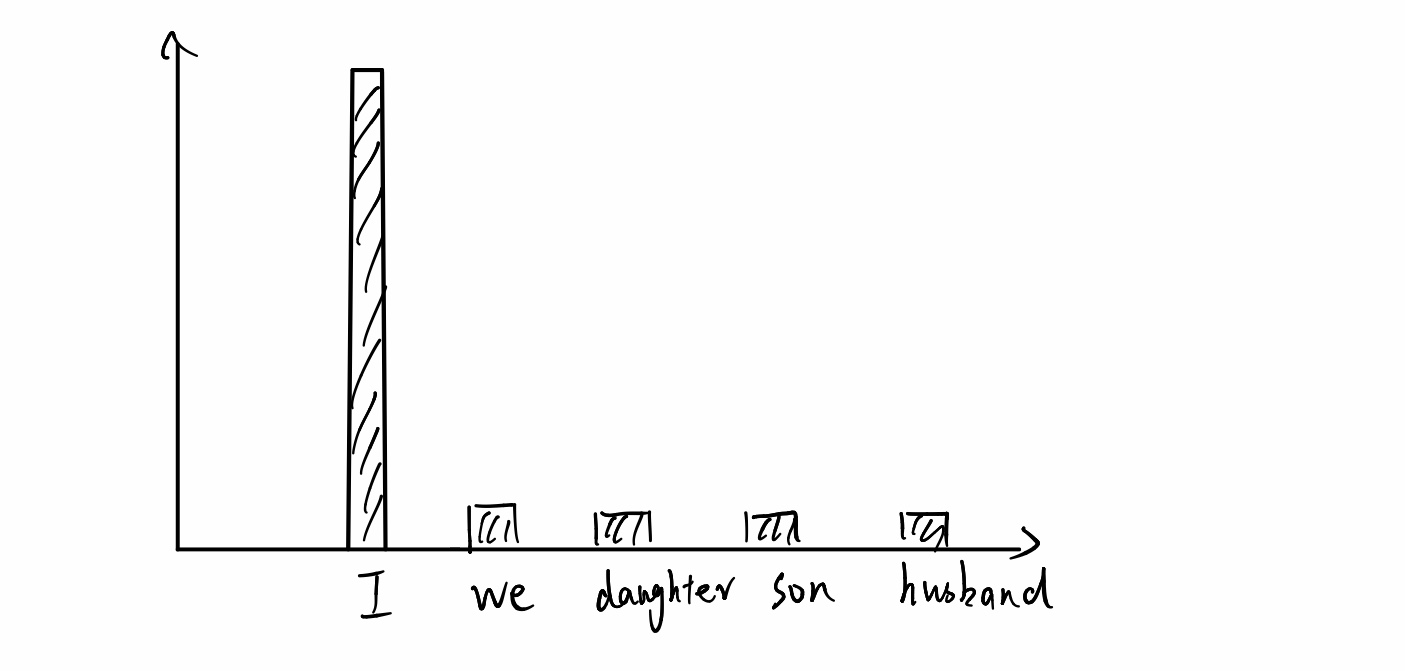
The happy moment subject distribution by bar chart.
-
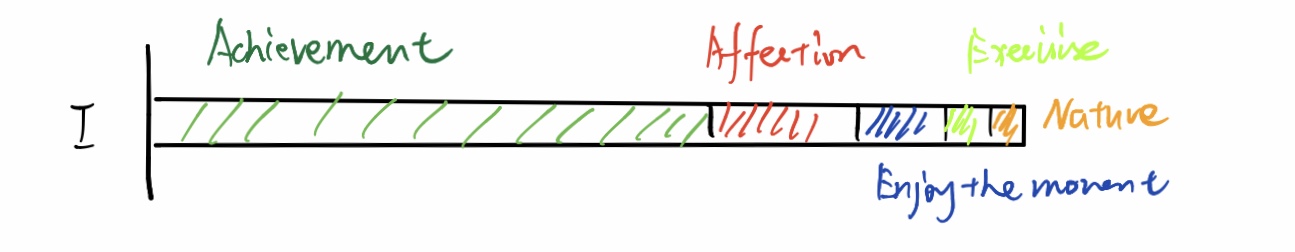
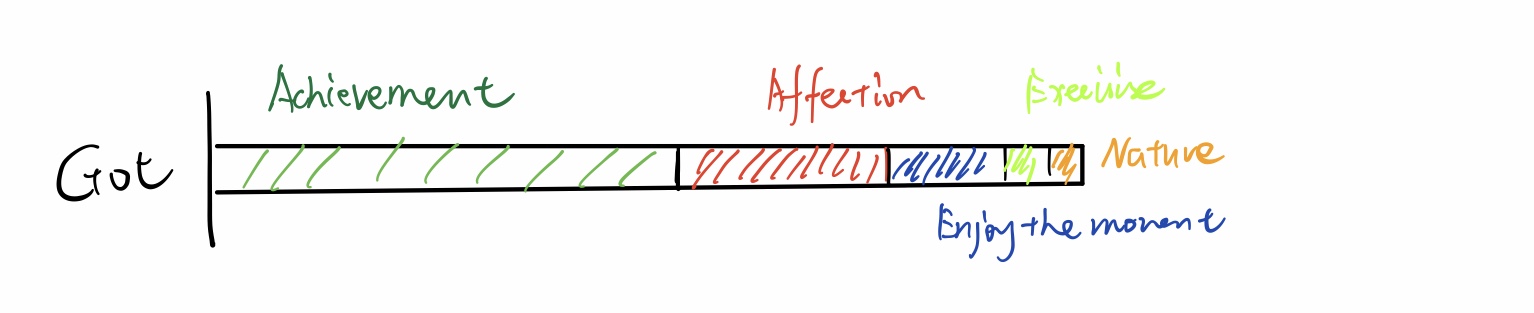
For the top 1 subject, distribution of different categories by stacked bar chart.
-
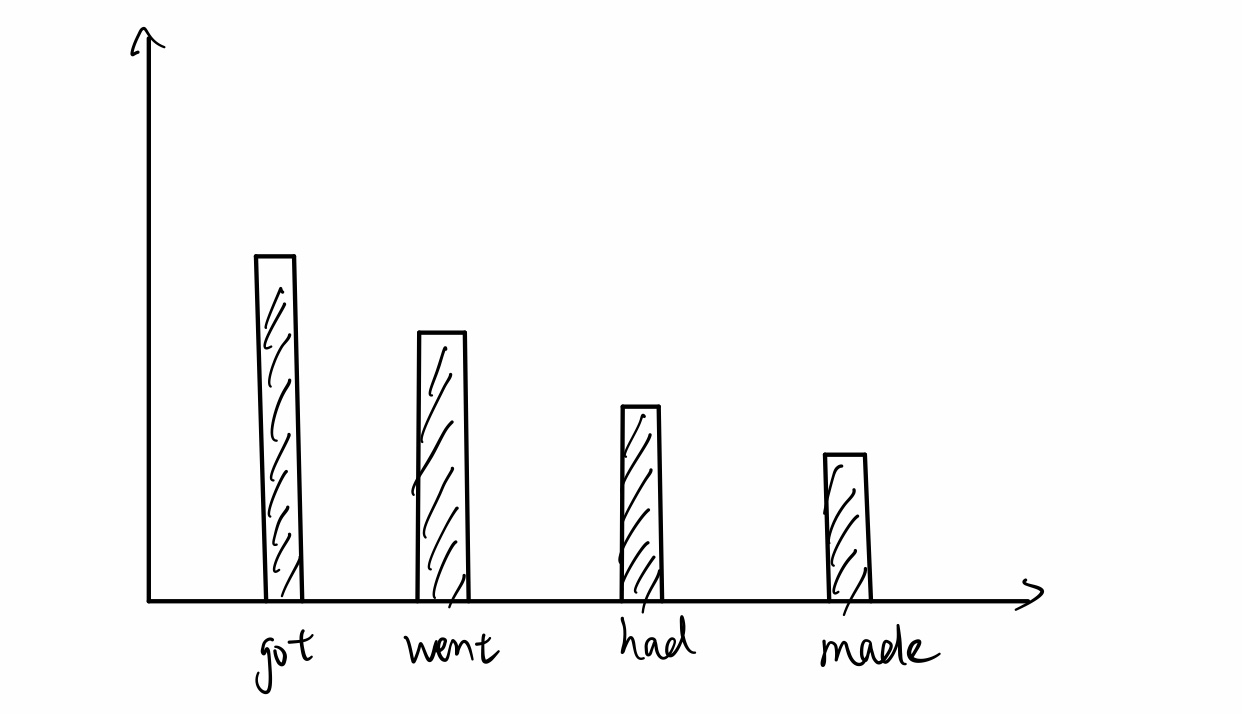
The happy moment verb distribution by bar chart.
-
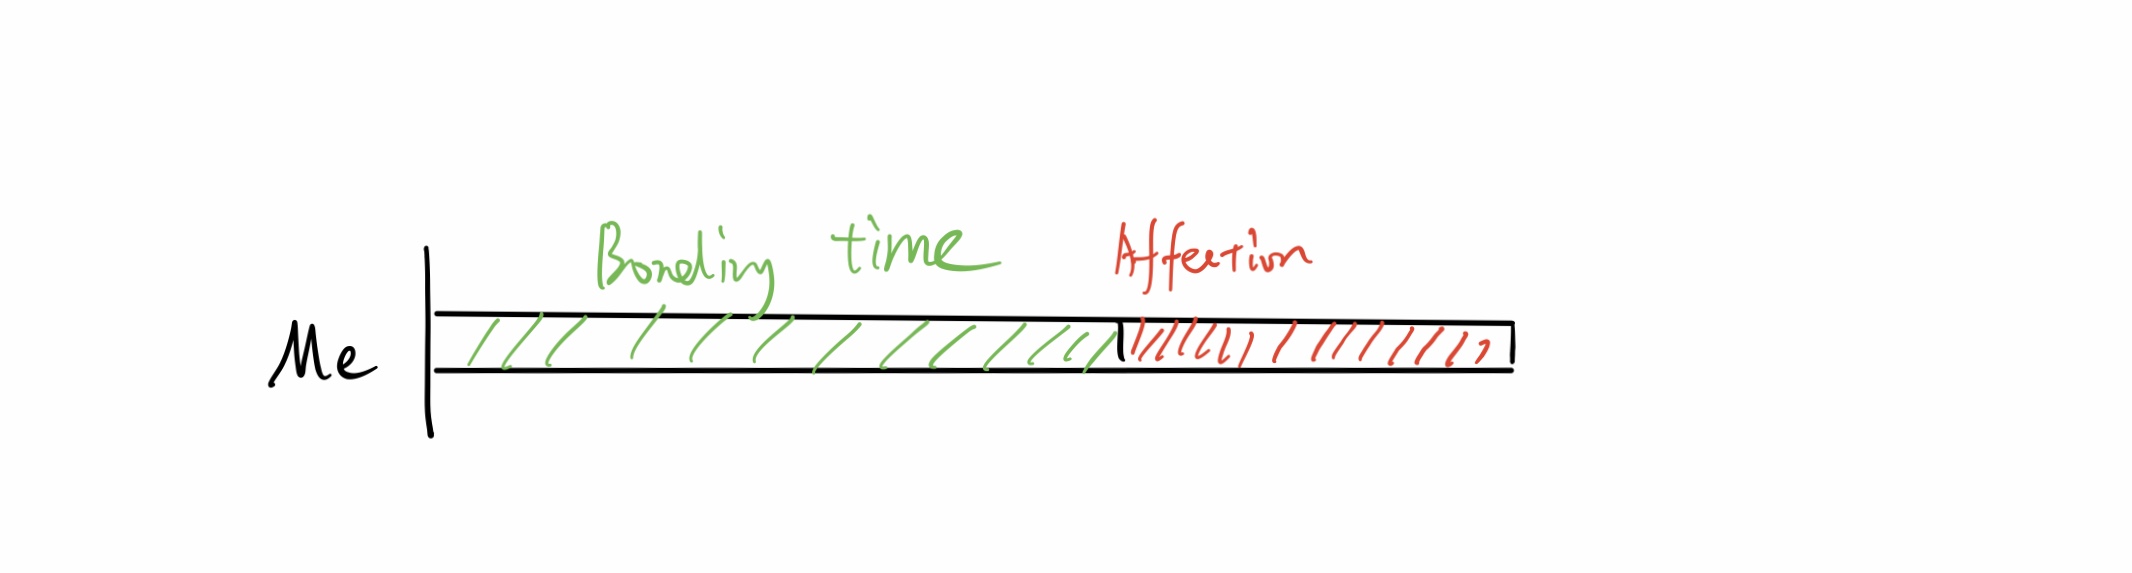
For the top 1 verb, distribution of different categories by stacked bar chart.
-
The happy moment object distribution by bar chart.
-
For the top 1 object, distribution of different categories by stacked bar chart.
Data
Introduction of the data: HappyDB is a corpus of 100,000 crowd-sourced happy moments. More specifically, the collaboration between the University of Tokyo, MIT, and Recruit Institute of Technology asked participants on Mechanical Turk to list 10 happy moments. This generated a corpus of 100,000 happy moments called HappyDB.
How to use the data: I will clone the repository from github to download the data to local path and analyze the data with python.
Medium and method
I will utilize shorthand for the presentaton, Tableau to prepare charts with data, and python to analyze data for the final project.